
Let’s go MERFISH-ing!
Author: Malleeka Suy
Editor: Tarati Papisetty

It’s a mermaid! It’s a fish! It’s a…technique that maps thousands of gene transcripts within a tissue sample?! Okay, so maybe this doesn’t have anything to do with sealife or serene pastimes, but it does have something to do with how we can “map” our brains using single-cell spatial transcriptomics, a fancy-sounding method that measures gene expression while keeping the location of the cells and tissue intact. This is a lot to unpack, so let’s go MERFISH-ing!
To understand how MERFISH works, we first need to understand what RNA is. Different genes are made up of different DNA sequences. When a gene undergoes transcription, a process that reads DNA, it produces strands of code called ribonucleic acid, or RNA. Quantifying RNA transcripts in a specific cell or region allows researchers to characterize cellular activity, model diseases, and tailor treatments. RNA sequencing is a common technique used in research labs to sequence the RNA molecules in cells. The RNA is isolated from a cell or tissue sample, converted to DNA, and sequenced, allowing researchers to identify the RNA molecules present in the sample. (National Human Genome Research Institute).
But what if you not only wanted to profile the RNA transcripts in a cell or tissue, but also visualize where different RNA transcripts are across regions in a larger sample? Or what if you didn’t want to destroy the sample completely? For instance, instead of focusing on a region of the brain such as the prefrontal cortex, could you profile RNA transcripts within cells across the entire brain? No technique at the time could achieve these results on such a large scale until MERFISH was introduced in 2015.
At Harvard University, Dr. Xiaowei Zhuang and her lab collaborated with the biotechnology company Vizgen to develop multiplexed error-robust fluorescence in situ hybridization, or MERFISH. Zhuang’s paper introducing MERFISH, “Spatially resolved, highly multiplexed RNA profiling in single cells”, was published in Science and has been cited over 4,500 times in academic literature (Chen et. al., 2015).
But what exactly is MERFISH, and why has it been so important? Surprisingly, it has nothing to do with fish. MERFISH is a method that images thousands of RNAs in individual cells. More specifically, it can visualize and count up to a billion RNA transcripts from up to 10,000 different genes in each cell, all within a 1-by-2-centimeter tissue slice (Vizgen)! This allows researchers to spatially localize transcripts with single-molecule accuracy and map gene expression and cellular composition, all to a nanometer-scale resolution.
How It Works:
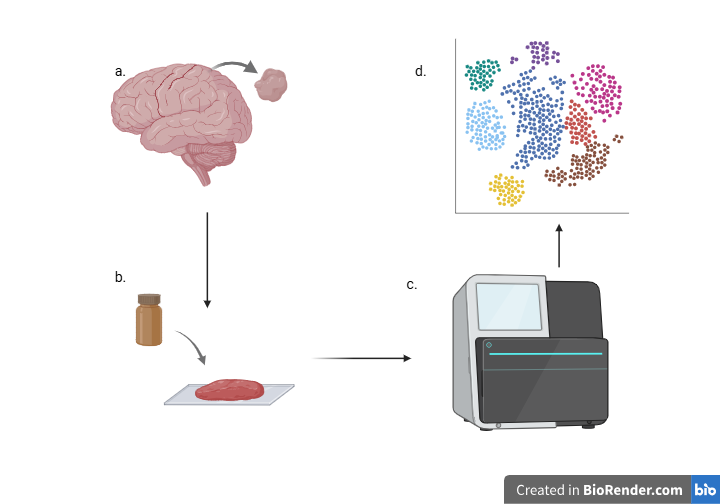
MERFISH is actually an expansion on an existing spatial transcriptomic technique: single-molecule FISH, or smFISH. First, you start with a list of genes and the corresponding RNA transcripts they produce. In smFISH, fluorescent probes bind to specific RNA targets in the tissue and produce fluorescent signals. The MERSCOPE, which is the Vizgen platform used to image the sample, then counts the different fluorescent spots to quantify RNA expression. smFISH works well in counting and mapping RNA, but it can only focus on a couple of genes and RNA transcripts, limiting its spatial capabilities.
MERFISH introduces three different features to smFISH to allow for more expansive and accurate counting and imaging (Vizgen). First, the probes in the staining now contain a unique barcode corresponding to a target gene. Secondly, there are multiple rounds of imaging to allow the MERSCOPE to read the barcode bit by bit. Each round determines whether a fluorescent signal is present, revealing another bit of the barcode. Third, error robust barcoding catches any errors in reading the barcode. For example, if some background fluorescence in the sample causes a reading error, the MERFISH system assigns what’s been transcribed to the nearest correct barcode (Vizgen).
MERFISH-ing The Brain
With billions of cells and even more transcripts produced in the brain, MERFISH has made a splash in neuroscience research. Millions of dollars have been invested in compiling data packages and brain cell atlases using MERFISH. For instance, the Brain Research through Advancing Innovative Neurotechnologies (BRAIN) was launched by the NIH as part of an effort to deepen the understanding of the human brain and how we can treat, prevent, and cure brain disorders. Since 2014, BRAIN has awarded $2.4 billion in research awards and grants, including a $126 million grant to the Salk Institute of Biological Sciences in efforts to map the aging human brain under BICAN (Salk Institute). The BRAIN Initiative Cell Atlas Network (BICAN) is a collaborative effort of many labs and tools across the United States to create an atlas of the brains of different species, such as mice and humans (BRAIN Initiative Cell Atlas Network). Data from this effort are publicly available on the Brain Knowledge Platform for reference, analysis, and experimental use.
Through this effort, a study published in Nature has imaged more than 1,100 genes across 10 million cells in the adult mouse brain using MERFISH (Zhang et. al., 2023). This comprehensive characterization of the mouse brain has allowed scientists to infer cell-cell communication and molecular interactions, such as possible ligand-receptor binding (Zhang et. al., 2023). In 2025, MERFISH revealed the molecular and cellular development of the human fetal cortex, producing an atlas comprised of over 18 million cells across eight cortical areas (Qian et. al., 2025). The study shed light on human cortical development, demonstrating how invaluable such high-resolution imaging and characterization have been for research.
What a Catch!
Through the engineering feat of Dr. Zhuang and her collaborators at Harvard and Vizgen, neurodevelopment, neuroepigenetics, and many other areas of neuroscience have benefited from MERFISH. Precisely characterizing cells in the brain while also preserving and visualizing where they are has proven paramount to how we understand brain formation and development. This fuels the race towards a cure for common neurological diseases and disorders such as Alzheimer’s or Huntington’s disease. By creating a “baseline” brain model, scientists can pinpoint specific cells or pathways to research, opening up avenues of discovery and innovation. What a catch!
Bibliography
Allen Institute for Brain Science. (n.d.). BRAIN Initiative Cell Atlas Network (BICAN). Brain Knowledge Platform. Retrieved August 25, 2026, from https://knowledge.brain-map.org/program/bican
Chen, K. H., Boettiger, A. N., Moffitt, J. R., Wang, S., & Zhuang, X. (2015). Spatially resolved, highly multiplexed RNA profiling in single cells. Science, 348(6233), aaa6090. https://doi.org/10.1126/science.aaa6090
McManus, A. (2023, October 13). Building a brain cell atlas with MERSCOPE. Vizgen. https://vizgen.com/building-a-brain-cell-atlas-with-merscope/
National Human Genome Research Institute. (2024, May 24). Ribonucleic acid (RNA) fact sheet. https://www.genome.gov/about-genomics/educational-resources/fact-sheets/ribonucleic-acid-fact-sheet
National Human Genome Research Institute. (n.d.). RNA-seq (RNA sequencing). In Talking glossary of genomic and genetic terms. Retrieved August 25, 2026, from https://www.genome.gov/genetics-glossary/RNA-seq
Qian, X., Coleman, K., Jiang, S., Kriz, A. J., Marciano, J. H., Luo, C., Cai, C., Manam, M. D., Caglayan, E., Lai, A., Exposito-Alonso, D., Otani, A., Ghosh, U., Shao, D. D., Andersen, R. E., Neil, J. E., Johnson, R., LeFevre, A., Hecht, J. L., … Walsh, C. A. (2025). Spatial transcriptomics reveals human cortical layer and area specification. Nature, 644(8075), 153–163. https://doi.org/10.1038/s41586-025-09010-1
Salk Institute for Biological Studies. (2022, September 22). Salk Institute to lead $126 million effort to map the aging human brain. https://www.salk.edu/news-release/salk-institute-to-lead-126-million-effort-to-map-the-aging-human-brain/
Vizgen. (n.d.-a). How MERFISH technology works. Retrieved August 25, 2026, from https://vizgen.com/resources/how-merfish-technology-works/
Vizgen. (n.d.-b). MERFISH: Spatially resolved transcriptomics. Retrieved August 25, 2026, from https://vizgen.com/technology/merfish-spatially-resolved-transcriptomics/
Wilson, S. (2023, April 25). Leading the global expansion of spatial transcriptomics. Vizgen. https://vizgen.com/vizgen-leading-the-global-expansion-of-spatial-transcriptomics/
Zhang, M., Pan, X., Jung, W., Halpern, A. R., Eichhorn, S. W., Lei, Z., Cohen, L., Smith, K. A., Tasic, B., Yao, Z., Zeng, H., & Zhuang, X. (2023). Molecularly defined and spatially resolved cell atlas of the whole mouse brain. Nature, 624(7991), 343–354. https://doi.org/10.1038/s41586-023-06808-9


Comments